GIS mit der Kommandozeile
Jakob Miksch
meggsimum - Büro für Geoinformatik
FOSSGIS 2021, Rapperswil, 08.06.2021
Jakob Miksch

- Geoinformatiker
- Anwendungsentwickler
- OSGeo Foundation Charter Member
meggsimum
- meggsimum.de
- Dienstleistungen im Bereich GIS, Webmapping & GDI
- Maßgeschneiderte WebGIS-Lösungen
- Softwarekonzepte und Softwareentwicklung
- Geodaten
- Beratung und Schulung
Warum?
Warum?
- reproduzierbar
- leichtgewichtig
- zeitlos
GDAL/OGR

fiona (OGR) & rasterio (GDAL)
- Wrapper für GDAL/OGR
- Python
- einfache Bedienung
fiona
Das Äquivalent zu OGRfiona
Formate- CSV
- Shapefile
- GeoPackage
- GPX
- GeoJSON
fiona
        Usage: fio [OPTIONS] COMMAND [ARGS]...

          Fiona command line interface.

        Options:
          -v, --verbose           Increase verbosity.
          -q, --quiet             Decrease verbosity.
          --aws-profile TEXT      Select a profile from the AWS credentials file
          --aws-no-sign-requests  Make requests anonymously
          --aws-requester-pays    Requester pays data transfer costs
          --version               Show the version and exit.
          --gdal-version          Show the version and exit.
          --python-version        Show the version and exit.
          --help                  Show this message and exit.

        Commands:
          bounds   Print the extent of GeoJSON objects
          calc     Calculate GeoJSON property by Python expression
          cat      Concatenate and print the features of datasets
          collect  Collect a sequence of features.
          distrib  Distribute features from a collection.
          dump     Dump a dataset to GeoJSON.
          env      Print information about the fio environment.
          filter   Filter GeoJSON features by python expression.
          info     Print information about a dataset.
          insp     Open a dataset and start an interpreter.
          load     Load GeoJSON to a dataset in another format.
          ls       List layers in a datasource.
          rm       Remove a datasource or an individual layer.
fio info
Informationen über Vektordaten
fio info chapters.json
          {
            "driver": "GeoJSON",
            "schema": {
              "properties": {
                "location": "str",
                "title": "str",
                "twitter": "str",
                "website": "str",
                "meetup": "str",
                "comingSoon": "str",
                "organizers": "str",
                "moreInfo": "str",
                "github": "str",
                "facebook": "str"
              },
              "geometry": "Point"
            },
            "crs": "EPSG:4326",
            "crs_wkt": "GEOGCS[\"WGS 84\",DATUM[\"WGS_1984\",SPHEROID[\"WGS 84\",6378137,298.257223563,AUTHORITY[\"EPSG\",\"7030\"]],AUTHORITY[\"EPSG\",\"6326\"]],PRIMEM[\"Greenwich\",0,AUTHORITY[\"EPSG\",\"8901\"]],UNIT[\"degree\",0.0174532925199433,AUTHORITY[\"EPSG\",\"9122\"]],AUTHORITY[\"EPSG\",\"4326\"]]",
            "bounds": [
              -149.9,
              -43.53137589928477,
              172.63572692871094,
              69.682778
            ],
            "name": "chapters",
            "count": 114
          }
fio info
          fio info --count shp/countries.shp
          # 177

          fio info --bounds shp/countries.shp
          # -180.0 -90.0 180.00000000000006 83.64513000000001

          fio info --crs chapters.json
          # EPSG:4326
rasterio
Äquivalent zu GDAL
        Usage: rio [OPTIONS] COMMAND [ARGS]...

          Rasterio command line interface.

        Options:
          -v, --verbose           Increase verbosity.
          -q, --quiet             Decrease verbosity.
          --aws-profile TEXT      Select a profile from the AWS credent
          --aws-no-sign-requests  Make requests anonymously
          --aws-requester-pays    Requester pays data transfer costs
          --version               Show the version and exit.
          --gdal-version
          Terms of Use

          You can use the API for your project, but please be fair - extensive usage will be throttled. We do not guarantee for the availability and usage might be subject of change in the future.

          Have fun with photon and make OSM grow!

        Commands:
          blocks     Write dataset blocks as GeoJSON features.
          bounds     Write bounding boxes to stdout as GeoJSON.
          calc       Raster data calculator.
          clip       Clip a raster to given bounds.
          convert    Copy and convert raster dataset.
          edit-info  Edit dataset metadata.
          env        Print information about the Rasterio environment.
          gcps       Print ground control points as GeoJSON.
          info       Print information about a data file.
          insp       Open a data file and start an interpreter.
          mask       Mask in raster using features.
          merge      Merge a stack of raster datasets.
          overview   Construct overviews in an existing dataset.
          rasterize  Rasterize features.
          rm         Delete a dataset.
          sample     Sample a dataset.
          shapes     Write shapes extracted from bands or masks.
          stack      Stack a number of bands into a multiband dataset.
          transform  Transform coordinates.
          warp       Warp a raster dataset.
rio info
rio info europe.tif
          {
            "bounds": [
              -19.1,
              28.733333333000004,
              45.866666667,
              76.3
            ],
            "colorinterp": [
              "red",
              "green",
              "blue"
            ],
            "count": 3,
            "crs": "EPSG:4326",
            "descriptions": [
              null,
              null,
              null
            ],
            "driver": "GTiff",
            "dtype": "uint8",
            "height": 1427,
            "indexes": [
              1,
              2,
              3
            ],
            "interleave": "pixel",
            "lnglat": [
              13.383333333499998,
              52.5166666665
            ],
            "mask_flags": [
              [
                "all_valid"
              ],
              [
                "all_valid"
              ],
              [
                "all_valid"
              ]
            ],
            "nodata": null,
            "res": [
              0.03333333333350436,
              0.03333333333356692
            ],
            "shape": [
              1427,
              1949
            ],
            "tiled": false,
            "transform": [
              0.03333333333350436,
              0,
              -19.1,
              0,
              -0.03333333333356692,
              76.3,
              0,
              0,
              1
            ],
            "units": [
              null,
              null,
              null
            ],
            "width": 1949
          }
rio bounds
rio bounds europe.tif
          {
            "bbox": [
              -19.1,
              28.733333333000004,
              45.866666667,
              76.30000000000001
            ],
            "geometry": {
              "coordinates": [
                [
                  [
                    -19.1,
                    28.733333333000004
                  ],
                  [
                    45.866666667,
                    28.733333333000004
                  ],
                  [
                    45.866666667,
                    76.30000000000001
                  ],
                  [
                    -19.1,
                    76.30000000000001
                  ],
                  [
                    -19.1,
                    28.733333333000004
                  ]
                ]
              ],
              "type": "Polygon"
            },
            "properties": {
              "filename": "europe.tif",
              "id": "0",
              "title": "europe.tif"
            },
            "type": "Feature"
          }
rio overview
rio overview europe.tif --build auto
rio overview --ls europe.tif
          Overview factors:
          Band 1: [2, 4, 8] (method: 'nearest')
          Band 2: [2, 4, 8] (method: 'nearest')
          Band 3: [2, 4, 8] (method: 'nearest')
JavaScript basiert
Mapshaper
Formate:- GeoJSON
- CSV
- Shapefile
- ...
Mapshaper
            Usage:  mapshaper - [options] ...

            I/O commands
              -i               input one or more files
              -o               output edited content

            Editing commands
              -affine          transform coordinates by shifting, scaling and rotating
              -classify        apply sequential or categorical classification
              -clean           fixes geometry issues, such as polygon overlaps and gaps
              -clip            use a polygon layer to clip another layer
              -colorizer       define a function to convert data values to color classes
              -dissolve        merge features within a layer
              -dissolve2       merge adjacent polygons (repairs overlaps and gaps)
              -divide          divide lines by polygons, copy polygon data to lines
              -dots            fill polygons with dots of one or more colors
              -drop            delete layer(s) or elements within the target layer(s)
              -each            create/update/delete data fields using a JS expression
              -erase           use a polygon layer to erase another layer
              -explode         divide multi-part features into single-part features
              -filter          delete features using a JS expression
              -filter-fields   retain a subset of data fields
              -filter-islands  remove small detached polygon rings (islands)
              -filter-slivers  remove small polygon rings
              -graticule       create a graticule layer
              -grid            create a grid of square or hexagonal polygons
              -inlay           inscribe a polygon layer inside another polygon layer
              -innerlines      convert polygons to polylines along shared edges
              -join            join data records from a file or layer to a layer
              -lines           convert a polygon or point layer to a polyline layer
              -merge-layers    merge multiple layers into as few layers as possible
              -mosaic          convert a polygon layer with overlaps into a flat mosaic
              -point-grid      create a rectangular grid of points
              -points          create a point layer from a different layer type
              -polygons        convert polylines to polygons
              -proj            project your data (using Proj.4)
              -rectangle       create a rectangle from a bbox or target layer extent
              -rectangles      create a rectangle around each feature in a layer
              -rename-fields   rename data fields
              -rename-layers   assign new names to layers
              -simplify        simplify the geometry of polygon and polyline features
              -snap            snap together nearby vertices
              -sort            sort features using a JS expression
              -split           split a layer into single-feature or multi-feature layers
              -split-on-grid   split features into separate layers using a grid
              -style           set SVG style properties using JS or literal values
              -target          set active layer (or layers)
              -union           create a flat mosaic from two or more polygon layers
              -uniq            delete features with the same id as a previous feature

            Experimental commands (may give unexpected results)
              -cluster         group polygons into compact clusters
              -data-fill       fill in missing values in a polygon layer
              -include         import JS data and functions for use in JS expressions
              -fuzzy-join      join points to polygons, with data fill and fuzzy match
              -require         require a Node module for use in -each expressions
              -run             create commands on-the-fly and run them
              -shape           create a polyline or polygon from coordinates
              -subdivide       recursively split a layer using a JS expression

            Informational commands
              -calc            calculate statistics about the features in a layer
              -colors          print list of color scheme names
              -encodings       print list of supported text encodings (for .dbf import)
              -help, -h        print help; takes optional command name
              -info            print information about data layers
              -inspect         print information about a feature
              -projections     print list of supported projections
              -quiet           inhibit console messages
              -verbose         print verbose processing messages
              -version, -v     print mapshaper version

            Enter mapshaper -help  to view options for a single command
Mapshaper
mapshaper chapters.json -info
          [info]
          ==============================================
          Layer:    chapters
          ----------------------------------------------
          Type:     point
          Records:  114
          Bounds:   -149.9,-43.53137589928477,172.63572692871094,69.682778
          CRS:      +proj=longlat +datum=WGS84
          Source:   chapters.json

          Attribute data
          ------------+---------------------------------
          Field      | First value
          ------------+---------------------------------
          comingSoon | true
          facebook   | undefined
          github     | undefined
          location   | 'Paris, France'
          meetup     | ''
          moreInfo   | null
          organizers | [{"name":"nerik","twitter":""}]
          title      | 'MaptimeParis'
          twitter    | ''
          website    | 'http://maptime.io/paris/'
          ------------+---------------------------------
Mapshaper
Umwandlung Format
mapshaper chapters.json -o chapters.shp
Mapshaper
- Braucht nur JavaScript
- kein GDAL/OGR nötig
Deskop GIS Automatisieren
- QGIS - qgis_process
- GRASS GIS
- SAGA GIS
qgis_process
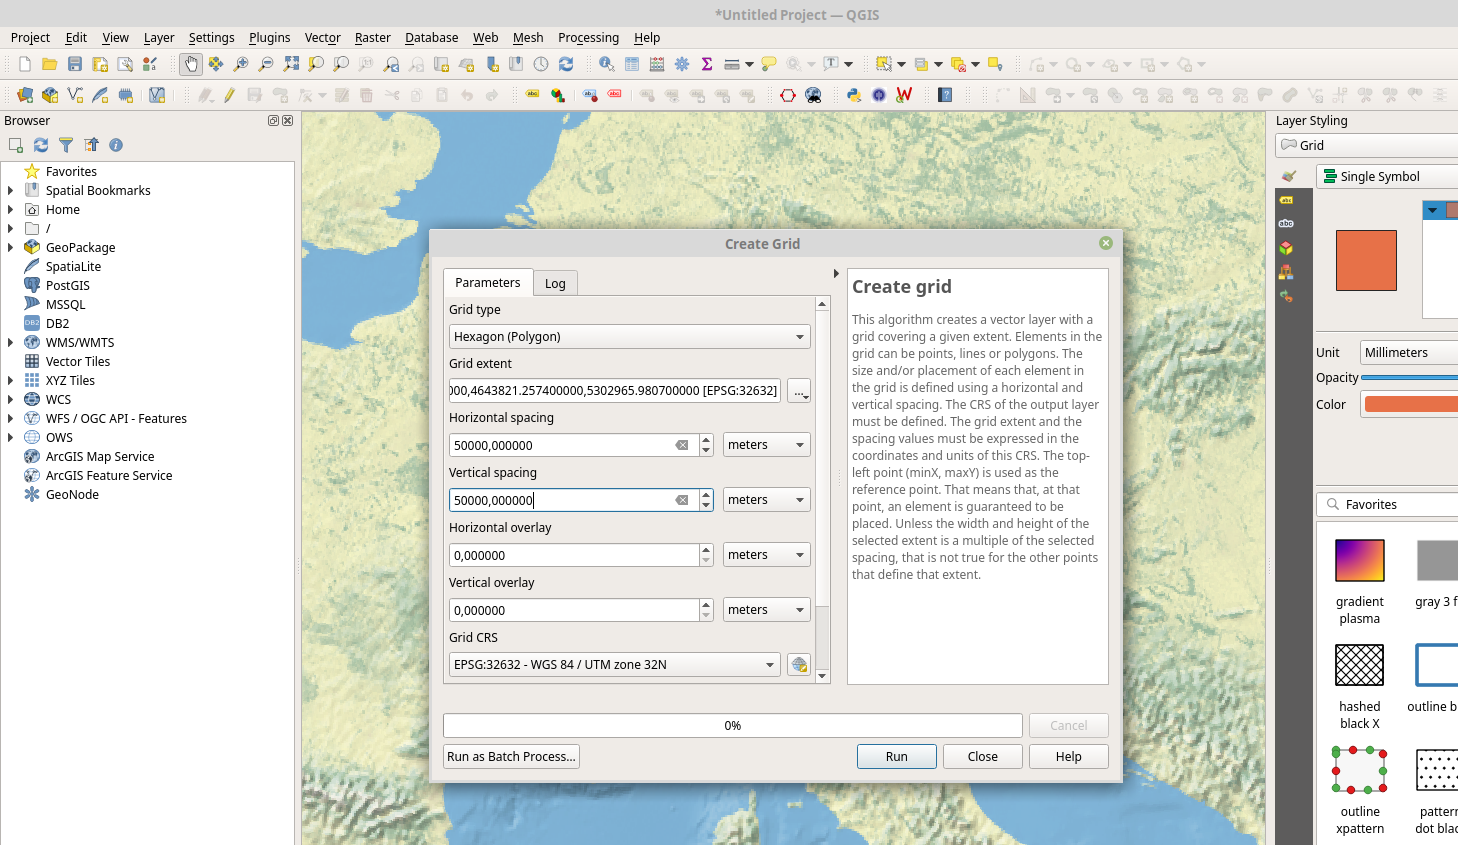
qgis_process
qgis_process
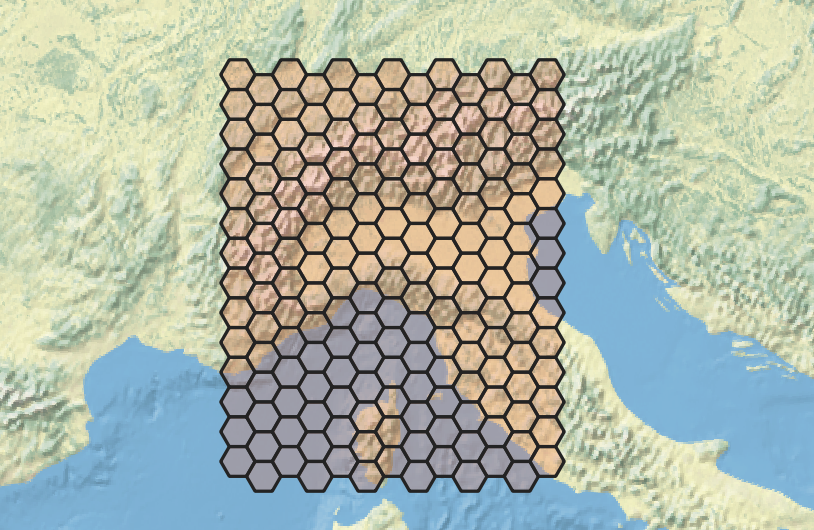
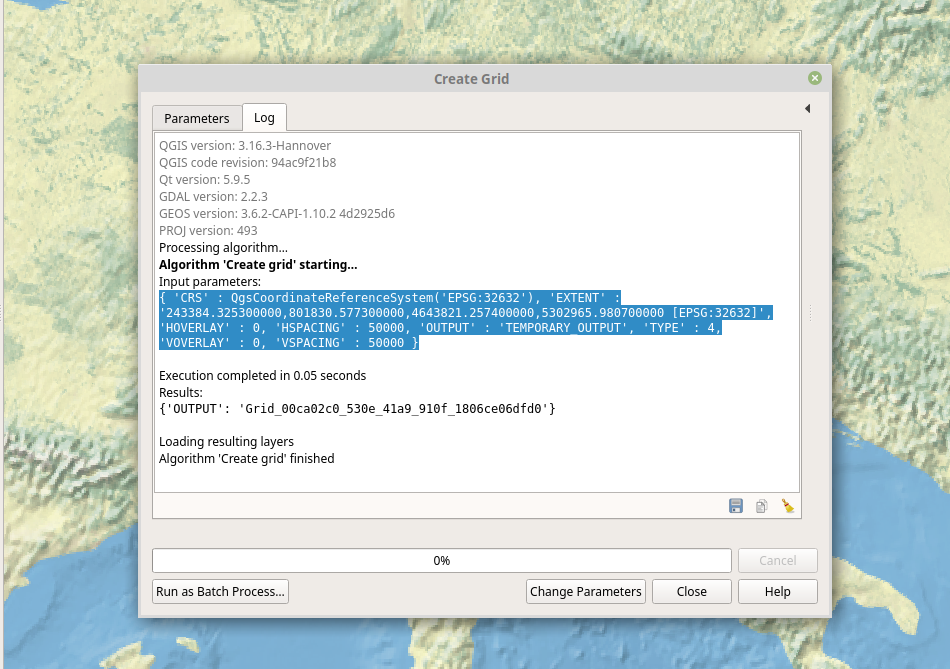
          qgis_process run native:creategrid \
          --EXTENT='243384.325300000,801830.577300000,4643821.257400000,5302965.980700000 [EPSG:32632]' \
          --TYPE=4 \
          --HSPACING=50000 \
          --VSPACING=50000 \
          --CRS='EPSG:32632' \
          --OUTPUT='qgis-hex2.geojson'
qgis_process
qgis_process
- geht mit allen Processing-Tools
- auch mit eigenen und Plugins
Schnittstellen (APIs)
- GeoCoding
- Routenplanung
GeoCoding mit Photon
          curl 'https://photon.komoot.io/api/?q=rapperswil' \
          > rapperswil.geojson
          {
            "features": [
              {
                "geometry": {
                  "coordinates": [
                    8.8245459,
                    47.2269198
                  ],
                  "type": "Point"
                },
                "type": "Feature",
                "properties": {
                  "osm_id": 240062727,
                  "osm_type": "N",
                  "country": "Schweiz/Suisse/Svizzera/Svizra",
                  "osm_key": "place",
                  "city": "Rapperswil-Jona",
                  "countrycode": "CH",
                  "osm_value": "town",
                  "postcode": "8640",
                  "name": "Rapperswil",
                  "county": "Wahlkreis See-Gaster",
                  "state": "Sankt Gallen",
                  "type": "district"
                }
              },
              {
                "geometry": {
                  "coordinates": [
                    8.815640768301005,
                    47.2273187
                  ],
                  "type": "Point"
                },
                "type": "Feature",
                "properties": {
                  "osm_id": 417258377,
                  "extent": [
                    8.8153123,
                    47.2275216,
                    8.8159567,
                    47.2271274
                  ],
                  "country": "Schweiz/Suisse/Svizzera/Svizra",
                  "city": "Rapperswil",
                  "countrycode": "CH",
                  "postcode": "8640",
                  "county": "Wahlkreis See-Gaster",
                  "type": "house",
                  "osm_type": "W",
                  "osm_key": "historic",
                  "street": "Lindenhügel",
                  "district": "Rapperswil",
                  "osm_value": "castle",
                  "name": "Schloss Rapperswil",
                  "state": "Sankt Gallen"
                }
              },
              {
                "geometry": {
                  "coordinates": [
                    8.8156217,
                    47.2272484
                  ],
                  "type": "Point"
                },
                "type": "Feature",
                "properties": {
                  "osm_id": 4192210341,
                  "country": "Schweiz/Suisse/Svizzera/Svizra",
                  "city": "Rapperswil-Jona",
                  "countrycode": "CH",
                  "postcode": "8640",
                  "county": "Wahlkreis See-Gaster",
                  "type": "house",
                  "osm_type": "N",
                  "osm_key": "tourism",
                  "street": "Hauptplatz",
                  "district": "Rapperswil",
                  "osm_value": "museum",
                  "name": "Polenmuseum",
                  "state": "Sankt Gallen"
                }
              }
            ],
            "type": "FeatureCollection"
          }
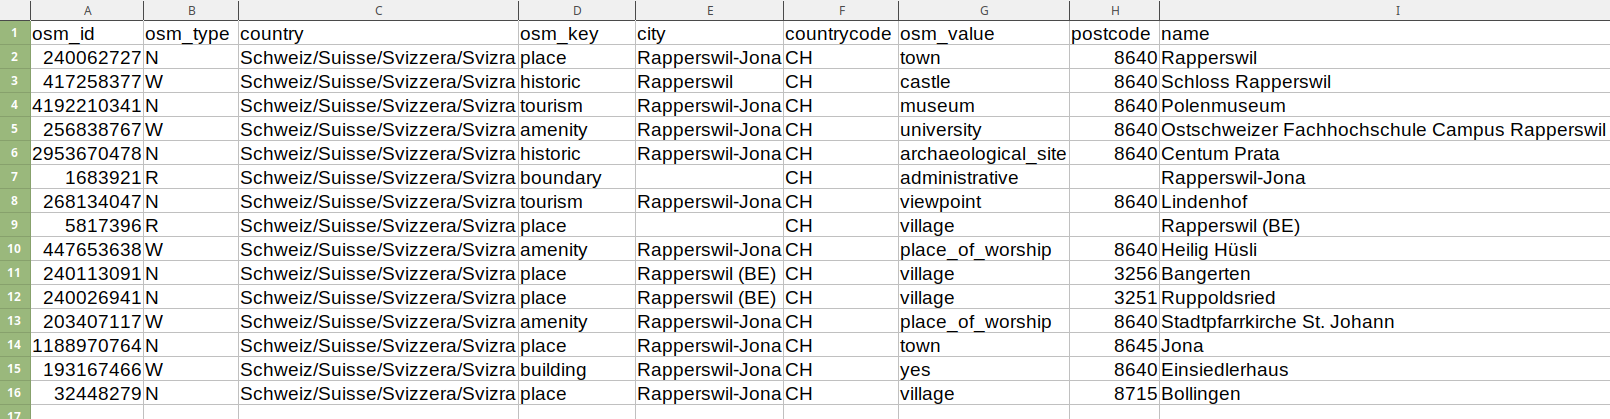
Umwandlung in CSV
          mapshaper \
          -i rapperswil.geojson \
          -o rapperswil.csv
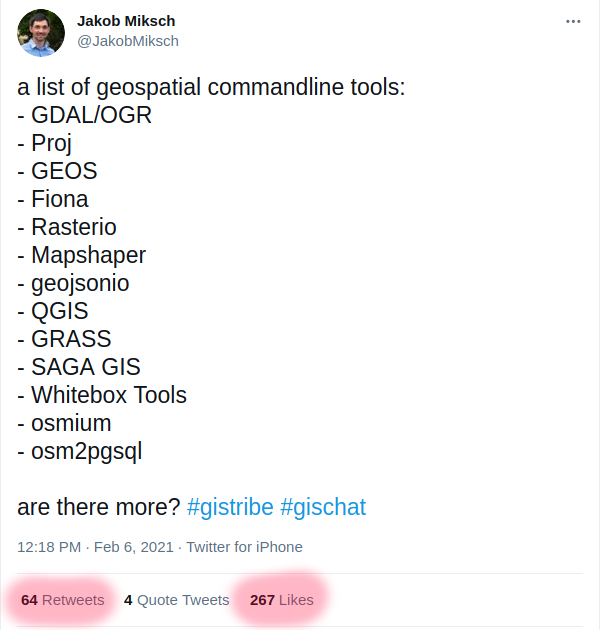
Weitere Programme
Links
Impressum
Autor
Jakob Miksch
meggsimum - Büro für Geoinformatik (Christian Mayer)
Schillerstraße 2a
67122 Mutterstadt
info@meggsimum.de
meggsimum - Büro für Geoinformatik (Christian Mayer)
Schillerstraße 2a
67122 Mutterstadt
info@meggsimum.de
Lizenz
Diese Folien sind unter CC BY-SA veröffentlicht.